
Valorant Round Distribution Per Map
Even though Valorant is a game that allows both sides of the map to be able to pick the same agents and weapons unlike other counterparts. However, considering the layout of the map, the fact that there is an objective side of the game (planting/defusing the spike) and that some agents are good on specific sides.
There can be times that a map is not perfectly balanced and one side can be favorable over the other one.
Round Win Distribution Per Map
I have taken the matches played in the Radiant bracket in this season (Episode 7 Act 3) and have used that data to show the round distribution for each map below.
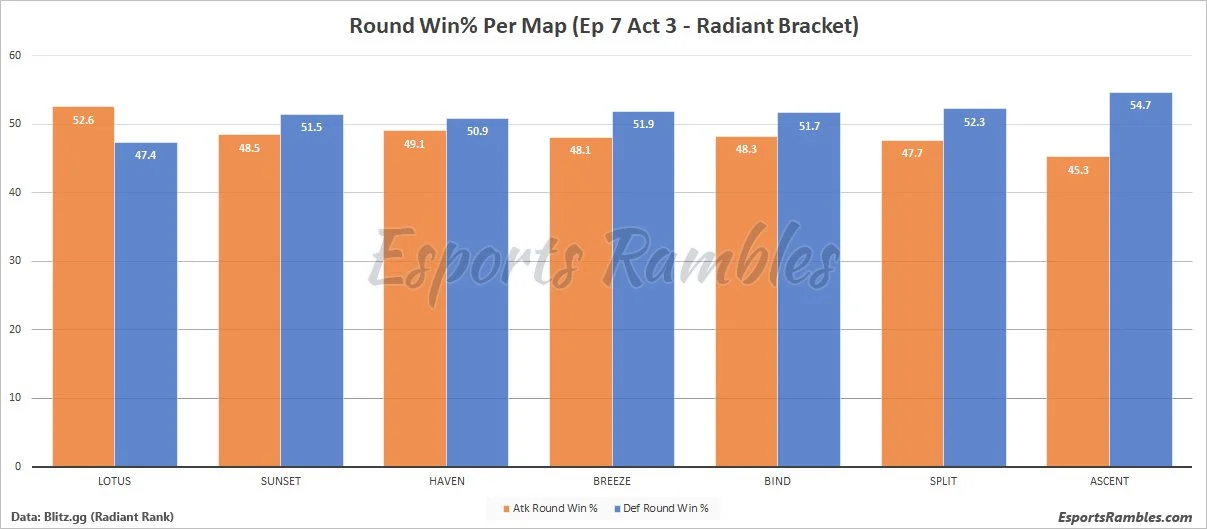
As you can see that even though the game is going to be defender sided most of the time. A map like Split or Ascent tends to favor them a lot more than the other maps but, there’s also Lotus in the map pool where the attacker side seems to win more rounds which is not a common thing to see.
You can see the complete stats in tabular form below:
|
Map
|
Atk Round Win %
|
Def Round Win %
|
Matches
|
|

|
Lotus | 52.6% | 47.4% | 4,323 |

|
Sunset | 48.5% | 51.5% | 4,180 |

|
Haven | 49.1% | 50.9% | 4,251 |

|
Breeze | 48.1% | 51.9% | 4,244 |

|
Bind | 48.3% | 51.7% | 4,327 |

|
Split | 47.7% | 52.3% | 4,203 |

|
Ascent | 45.3% | 54.7% | 4,296 |
Previous Seasons
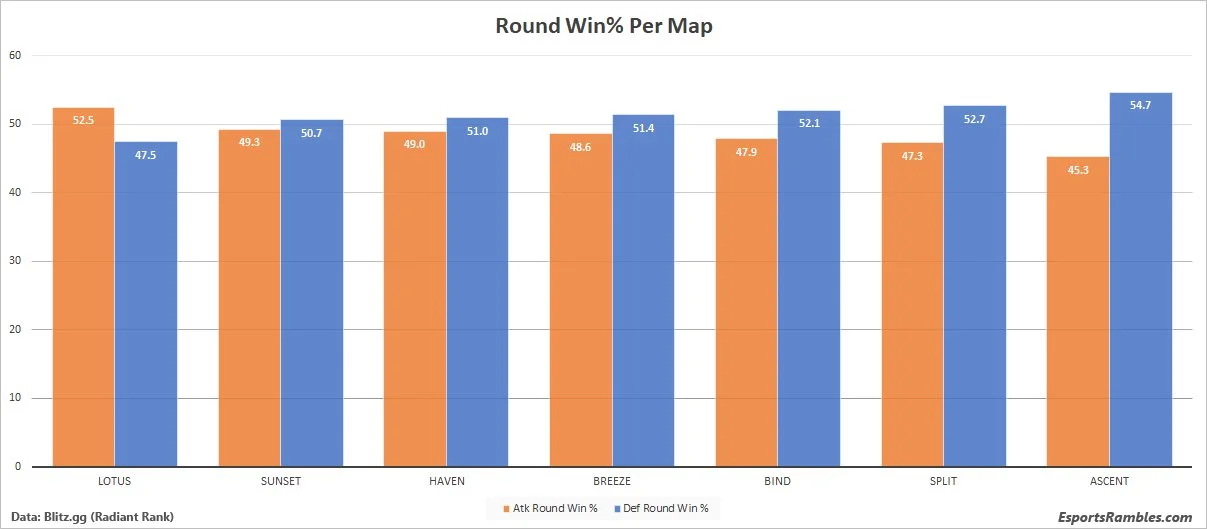
You can take a look at the statistics of the previous seasons here:
Episode 7 Act 2
Other Articles:
Featured image - Riot Games. | Statistics by Blitz.GG